
SOURABH MORE
Simulation/Graphics Software Engineer | CAE Engineer | Python & C++ Developer | 3D Modeling | AI & Data Analytics | Graphics and Data Visualization | FEM/FEA
About Me
I’m a simulation/graphics-focused software engineer with an M.S. in Computer Science from Oregon State University, specializing in FEM/FEA pipelines, scientific visualization, and graphics for interpreting complex physical data.My drive comes from shipping end-to-end workflows: model → solve → validate → visualize. I’ve built nonlinear, contact-rich simulations (Abaqus, Siemens NX, Nastran/HyperWorks), calibrated materials, and automated post-processing to compare solvers, convergence, and error so decisions are grounded, not guessed.Lately, I’ve been bridging physics with data methods: Python/C++ automation, scientific dashboards, and Topological Data Analysis (persistence diagrams, Reeb graphs) to reveal patterns in stress and dynamics that raw plots miss.I’m currently exploring roles where I can scale these strengths in production: Simulation Software Engineer / Graphics Software Engineer / CAE Engineer / Structural Analysis Engineer / Computational Mechanics, owning model fidelity, solver performance, and visualization UX. Keywords: Python, C++, FEM/FEA, Abaqus, Siemens NX, Nastran, HyperWorks, ParaView, MATLAB, CI/CD, dashboards.If your team values rigorous modeling, clean automation, and readable visuals that speed engineering decisions, let’s connect.
Skills/Tools

Excel | Tableau | Power BI | SQL | Python | C++| Scientific Visualization | Finite Element Method (FEM) | Tensor Field & Stress Analysis | Numerical Methods & Optimization | Abaqus | Ansys | Siemens NX | LS-Dyna | Blender | MATLAB |Unity | OpenGL |
Data Visualization - 2+ years
Research - 2+ Years
Team Management - 2+ Years
Problem Solving - 3+ Years
Work Experience
Graduate Researcher – OSU
Jan 2024 - Dec 2025
- Physics Modeling (FEM): Built 3D racket–shuttle impact models in Siemens NX & Abaqus/Explicit, using linear elastic, hyperelastic, and viscoelastic formulations; calibrated Mooney–Rivlin & Prony series with drop/creep tests; implemented tied, frictional, cohesive contact.
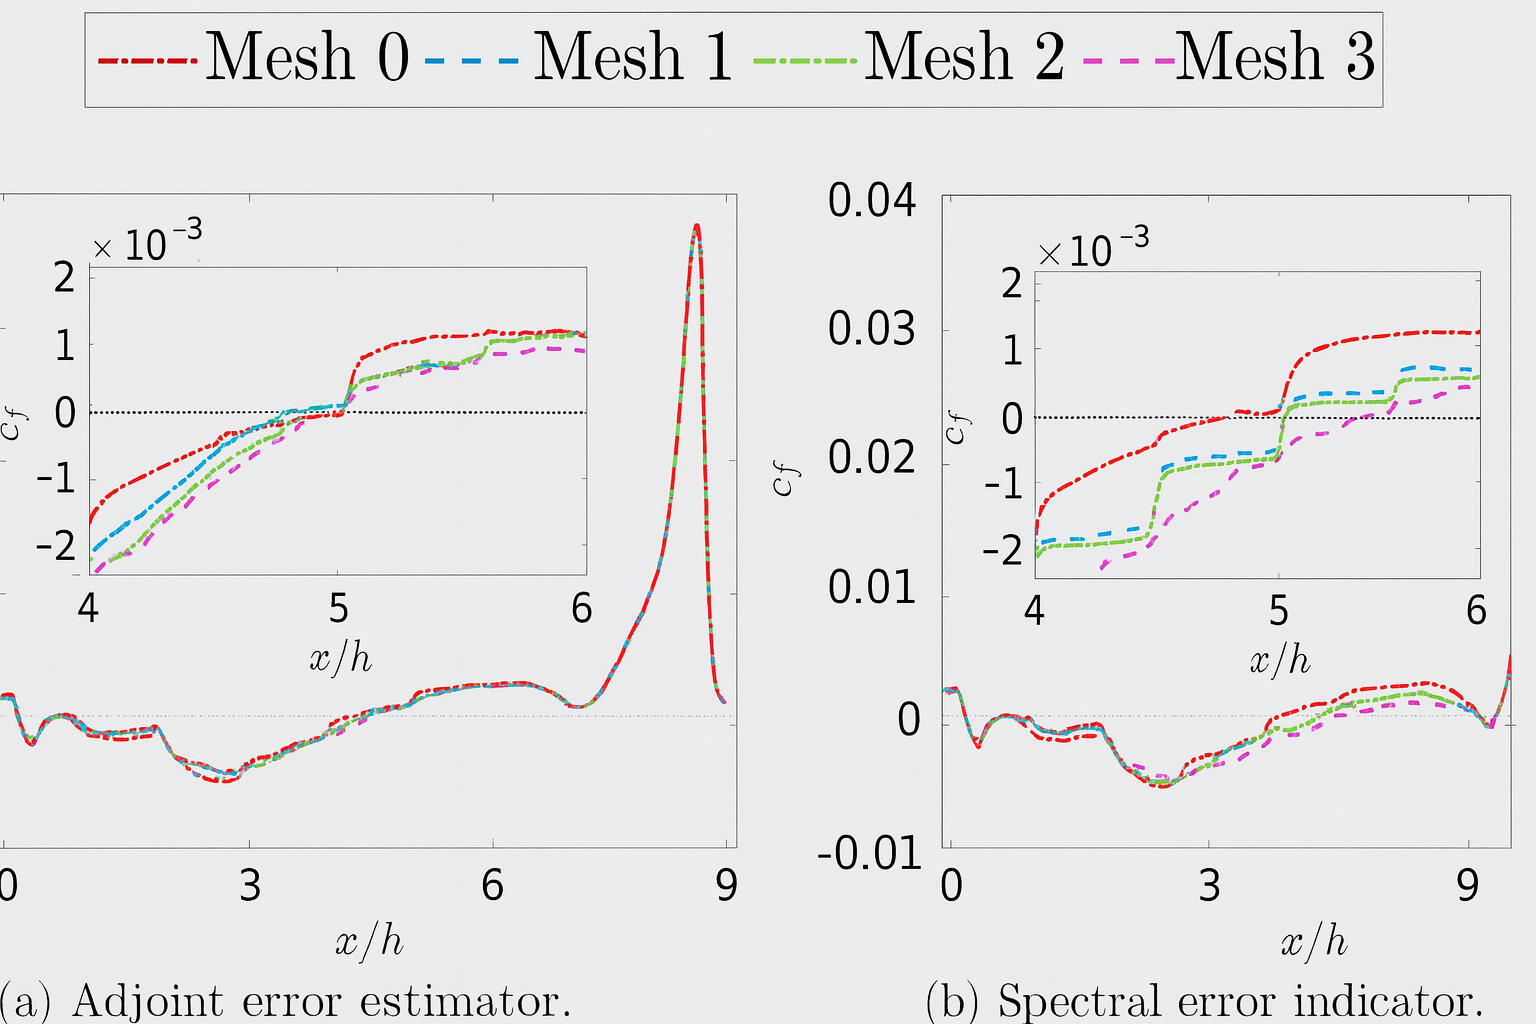
- Numerical Analysis: Performed mesh & time-step refinement with <5% error targets; compared implicit vs. explicit schemes; optimized mass scaling, bulk viscosity, hourglass control; documented convergence curves & solver QA checklists.
- Visualization & Post-Processing: Automated extraction of scalar (von Mises, principal), vector, tensor fields; built dashboards with contour maps, probe plots, timelines; exported CSV/images/animations for NX ↔ Abaqus validation.
- TDA on Stress Fields: Applied persistent homology & Reeb graphs to stress/strain fields; generated persistence diagrams & landscapes; benchmarked Lp-norm features vs. rebound stability; built Python/Colab pipelines for FEM–TDA integration.

Simulation Software Engineering Intern - Nirmitee Consultants
March 2022 - May 2023
- Developed and optimized physics-based simulation workflows for structural and mechanical models using Python, C++, and numerical libraries such as NumPy, Pandas, and Eigen.
- Automated Finite Element Analysis (FEA) preprocessing and postprocessing pipelines—integrating mesh generation, boundary condition assignment, and result extraction to accelerate R&D iterations.
- Implemented data-driven regression and error estimation modules for simulation datasets to improve prediction accuracy and sensitivity analysis.
- Created custom visualization dashboards and 2D/3D plotting utilities using Matplotlib, Plotly, and ParaView scripts for comparative analysis of material performance metrics.
- Designed automated validation scripts for simulation outputs with version-controlled documentation (Git) and continuous integration workflows, ensuring traceability and reproducibility across experiments.
- Collaborated with civil engineers and analysts to integrate simulation intelligence with real-world testing data, improving cross-validation accuracy between experimental and simulated results.

Featured Projects

Adaptive FEM in Python — Error Driven Mesh RefinementPYTHON | FEM | SCIPY | MESH REFINEMENT | NUMERICAL ANALYSIS
Developed an adaptive FEM solver for the 2D Poisson equation, implementing error-driven mesh refinement with ZZ estimators and convergence visualization.
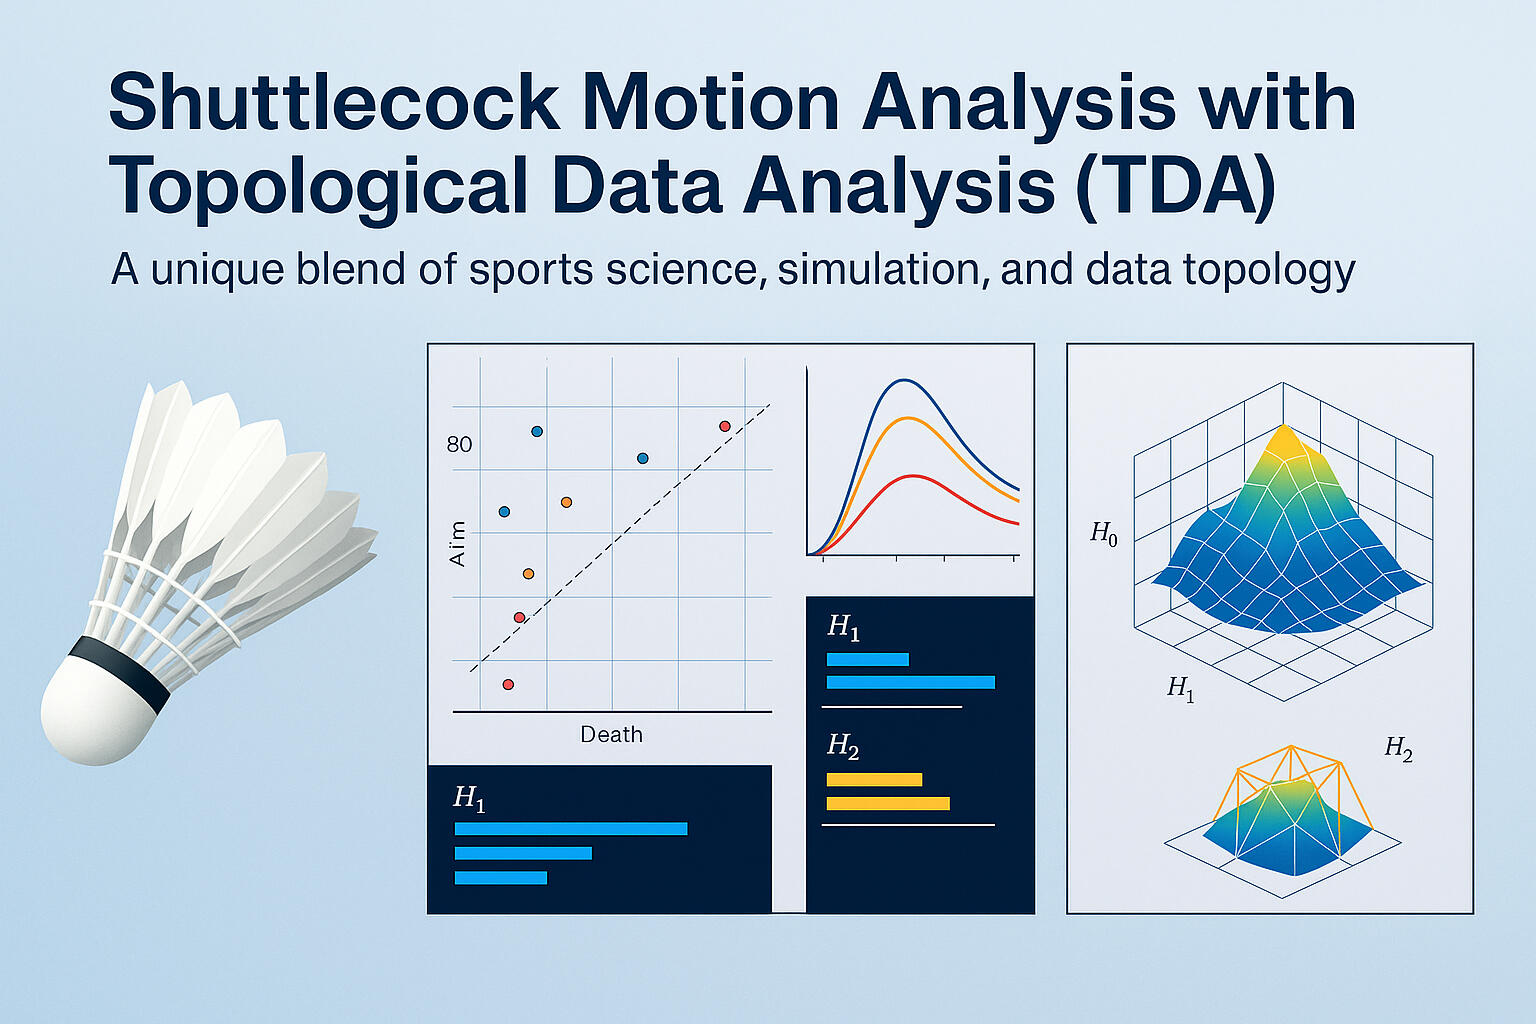
Topological Data Analysis of Shuttlecock MotionPYTHON | FEM | TOPOLOGICAL DATA ANALYSIS | PERSISTENT HOMOLOGY | SPORTS DYNAMICS
Applied Topological Data Analysis (TDA) and Persistent Homology to FEM-generated shuttlecock-motion data to uncover geometric patterns linking stiffness, damping, and material type to bounce dynamics.


Mac vs. Windows Usability StudyPython | Power BI | Matplotlib Seaborn |
Performed statistical analysis and visual reporting to evaluate platform usability using hypothesis testing and user interaction metrics.
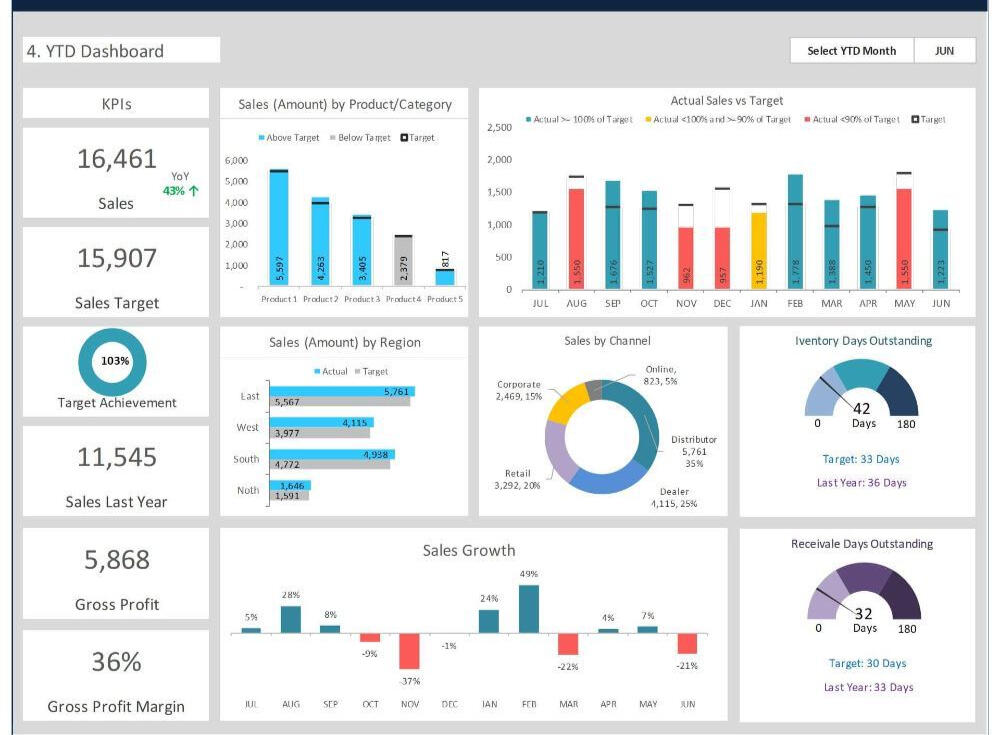
Sales Data AnalysisSQL | DAX | Power BI | ETL |
Engineered a complete ETL pipeline and KPI dashboard for trend forecasting and revenue analysis in retail sales data.

Professional Certifications
My Growing List of Proprietary, Exam-Based Certifications

FEM – Linear, Nonlinear Analysis & Post-Processing
Issued: Sept 2025

Data Analytics Job Simulation - Deloitte Australia
Issued: July 2025

Python – HackerRank | Issued: August 2021

Database Foundation – Oracle | Issued: Oct 2020

Building Systems with ChatGPT API - Open AI
Issued: March 2025

Google Data Analytics Professional Certification
Issued: Oct 2025
Relevant Coursework
Graduate (2023-2025)
AI534 - Machine Learning
CS550 - Computer Graphics
CS558 - Information Visualization
CS565 - Human Computer Interaction
CS567 - Lab Studies in SE and HCI
CS527 - Error Correcting Codes
CS552 - Computer Animation
CS574 - Operating Systems II
CS559 - ST/Visual Analytics in Sci and Tech
CS559 - ST/Topological Data Analysis
CS554 - Geometric Modelling/Comp Graph

UnderGradrad (2019 - 2023)
18MES101L - Engineering Graphics and Design
18CSS101J - Programming For Problem Solving
18CSC201J - Data Structure and Algorithms
18CSC305T - Artificial Intelligence (AI)
18CSC202J - Object Oriented Design and Programming
18CSC204J -Design and Analysis of Algorithms
18CSC206J - Software Engineering
18CSC207J - Advance Programming
18CSC302J - Computer Networks
18CSC303J - Database Management System (DBMS)
18CSC304J - Compiler Design
18CSE379T - Internet of Things (IoT)
18ECO134T - Industrial Automation
18CSE378T - Cloud Computing
18CSE380T - Pervasive Computing

Adaptive FEM in Python — Error Driven Mesh RefinementPYTHON | FEM | SCIPY | MESH REFINEMENT | NUMERICAL ANALYSIS
Questions I was interested in answering:
1. How can adaptive meshing improve the accuracy–efficiency balance in FEM simulations?
2.What role does a-posteriori error estimation (ZZ method) play in guiding mesh refinement?
3. How effectively can a pure Python solver (NumPy/SciPy) perform AMR without commercial solvers?Steps I took:
1. Built a from-scratch FEM pipeline for the 2D Poisson equation: mesh → assemble → solve → estimate → refine.
2. Implemented ZZ a-posteriori error estimator and Dörfler bulk marking with longest-edge bisection for refinement.
3. Automated the assembly of sparse stiffness matrices (CSR) and boundary enforcement using SciPy solvers.
4. Generated visual diagnostics—solution fields, error heatmaps, mesh evolution, and log–log convergence plots.
5. Validated performance through iterative refinement cycles, analyzing error vs. degrees of freedom (DOFs).Key takeaways:
1. Adaptive meshing concentrated elements where curvature was highest, reducing total error efficiently
2. The ZZ estimator proved simple yet effective for tracking local error distribution.
3. Sparse assembly and visualization pipelines in NumPy/SciPy enabled full reproducibility in Colab.
4. The convergence trend matched theoretical expectations, confirming correctness of refinement logic.
5. Future extensions include residual-based indicators and CG/AMG solvers for large-scale cases
Topological Data Analysis of Shuttlecock MotionPYTHON | FEM | TOPOLOGICAL DATA ANALYSIS | PERSISTENT HOMOLOGY | SPORTS DYNAMICS
Questions I was interested in answering:
1. How do material stiffness, damping, friction, and shape influence shuttlecock bounce height and stabilization time?
2. Do plastic and feather shuttles exhibit distinct persistent topological signatures?
3. Can TDA reveal nonlinear patterns beyond conventional FEM or CFD models?Steps I took:
1. Generated a high-dimensional dataset via FEM simulations, systematically varying stiffness, damping, friction, and shuttle geometry.
2. Applied Persistent Homology to compute H₀, H₁, H₂ features, capturing connected components, loops, and voids in the motion data.
3. Compared big-data clouds (all parameters) with subset clouds (individual factors) to isolate how each physical property affects topology.
4. Visualized results using 2D and 3D persistence diagrams and point-cloud embeddings (bounce height × stabilization × stiffness).
5. Interpreted persistence trends across shuttle types (feather vs plastic) and validated findings against FEM energy-decay behavior.Key takeaways:
1. Higher stiffness produced more persistent loops, reflecting greater bounce height and energy retention.
2. Increased damping reduced topological complexity, indicating faster stabilization.
3. Friction chiefly affected bounce amplitude, extending loop lifetimes under high resistance.
4. Plastic shuttles exhibited longer-lived topological structures than feather shuttles, matching observed rebound behavior.
5. TDA exposed hidden geometric invariants in shuttle dynamics, offering a new analytical layer beyond standard physics-based simulation.
Mac vs. Windows Usability StudyPython | Power BI | Matplotlib Seaborn |

Questions I was interested in answering:
1.How do Mac and Windows platforms differ in terms of user efficiency and satisfaction?
2.Are observed differences statistically significant?
3.What are the usability implications for interface design and platform preference?Steps I took:
1.Collected structured usability performance data (task time, errors, satisfaction scores) from user testing sessions.
2.Applied statistical modeling techniques such as t-tests, ANOVA, and Pearson correlation using SciPy.
3.Conducted data cleaning and transformation with Pandas and NumPy to prepare for analysis.
4.Visualized trends and outliers using Matplotlib and Seaborn for comparative analysis.
5.Created Power BI reports to communicate trends to non-technical stakeholders.Key takeaways:
1.Performance differences between Mac and Windows were marginal but suggested usability advantages for Windows in specific tasks.
2.Familiarity played a stronger role in satisfaction than platform capabilities.
3.Data-driven HCI evaluation helped bridge the gap between subjective feedback and objective performance metrics.
Sales Data AnalysisSQL | DAX | Power BI | ETL |
Questions I was interested in answering:
1.What are the revenue and order trends across different timeframes and categories?
2.How do specific products and customer segments contribute to sales growth?
3.Can we build an automated system for ongoing sales monitoring and forecasting?Steps I took:
1.Extracted raw sales data and built ETL pipelines using PowerQuery to clean and normalize datasets.
2.Designed calculated KPIs using DAX, such as average order value, YoY growth, and product-level revenue contribution.
3.Structured SQL queries to segment data by time, category, and region for detailed exploration.
4.Created interactive Power BI dashboards with slicers and drill-downs for executive-level reporting.Key takeaways:
1.Seasonal patterns and promotions were strongly correlated with revenue spikes.
2.A small percentage of SKUs contributed to the majority of revenue, confirming Pareto trends.
3.Dashboards empowered stakeholders with on-demand insights and reduced manual reporting overhead by 60%.